Mad genius Starlink constellation potential use cases
FunI prompted Grok to answer the following question: Consider that you are the owner of starlink and a mad genius […]
Mad genius Starlink constellation potential use cases Read More »
I prompted Grok to answer the following question: Consider that you are the owner of starlink and a mad genius […]
Mad genius Starlink constellation potential use cases Read More »
Three Ways to Install OpenClaw (and Why You Might Choose Each) If you’re getting started with OpenClaw—or rethinking how you
Three Ways to Install OpenClaw (and Why You Might Choose Each) Read More »
OpenAI Frontier and the Rise of Hands-On Enterprise AI Implementation https://openai.com/index/introducing-openai-frontier/ OpenAI recently introduced Frontier, a new enterprise-focused platform designed
OpenAI Frontier and the Rise of Hands-On Enterprise AI Implementation Read More »
From Marketplace Convenience to Owning the Box: Rebuilding OpenClaw the Hard Way I didn’t start this project intending to write
OpenClaw setup – Digital Ocean Marketplace app vs bare-server implementation Read More »
Extracting Data from Blood Pressure Device Photos into Using Flutter + LLMs This project was designed specifically for extracting structured
Flutter Photo Image Data Extraction Read More »
Building a Medication Reminder System with Voice AI Agents, Telephony, and LLM-Assisted Development This documents a recent project to provide
Medication Reminder System with Voice AI Agents Read More »
Media TV and Movies: Turning Streaming Viewing History into Outlook Calendar Events Like many people I watch TV and movies
Media TV and Movies: Turning Streaming Viewing History into Outlook Calendar Events Read More »
TL;DR I migrated about 295 GB / 400k files from a Microsoft 365 Business Standard OneDrive (source) into my personal Microsoft
TL;DR Canada’s Innovative Solutions Canada programme publishes the grants it gives to help SMEs solve public-sector challenges. But our deep
Introduction In this project, we successfully automated the synchronization of Outlook calendar events to a SharePoint list using Microsoft Graph
The Challenge of Multi-Tenant Data Solutions As a data and analytics consultant serving multiple customers, one of the biggest challenges
Use Microsoft Fabric to serve multi-tenant data & analytics Read More »
Sam Altman, CEO of OpenAI, shared a reflective blog post (Reflections) on January 5, 2025, offering a candid look at
A Shift in Tone: Unpacking Sam Altman’s Bold AGI Claims Read More »
Canada’s BDC (Business Development Bank of Canada) published a document in June 2024 titled “Canada’s Productivity Puzzle” link that highlighted
Canada’s productivity puzzle – tale of a cautious Canadian owner class Read More »
Introduction As a first-time Google Play Store publisher, I embarked on a journey to publish my app “AI Image Describe”
First-time journey publishing an app to the Google Play Store Read More »
Unlock the Hidden Power of Your Fitbit Data FitSignals transforms your Fitbit data into comprehensive, interactive visualizations that reveal insights
FitSignals – Google Watch Fitbit data and visualization Read More »
Light sphere – have radio waves reached any stars yet? Yes, radio waves have long reached many stars near to
Radio wave light spheres – radio waves washing over nearby stars Read More »
This was a project to create a visualization using data from tennis-data.co.uk, which provides up-to-date information on men’s and women’s
Visualization of tennis player rank vs match outcome and betting odds Read More »
A recent Google DeepMind project paper Scaling deep learning for materials discovery described using GNNs trained on a large and
DeepMind Materials new crystal structure data analysis Read More »
TLDR: It is pretty cool that you can directly leverage Deepmind’s cutting edge AI powered AlphaFold and AlphaMissense projects to
DeepMind AlphaMissense matched to 23andMe data Read More »
Legends can be quite fiddly to include on a chart when the chart content can dynamically change and result in
Apache EChart alternative faux legend solution Read More »
ChatGPT can help you by standardizing and categorizing bank and credit card descriptions. Steps: Copy and paste your bank or
Use ChatGPT to standardize and categorize bank and credit card descriptions Read More »
Gestalt is a form of communication that appears in Diaspora, a hard science fiction novel by the Australian writer Greg Egan
Gestalt communication facilitated by multi-modal generative AI? Read More »
Microsoft Copilot is coming across Microsoft products that will bring Copilot LLM user experience across Bing, Edge, Microsoft 365, and
Microsoft Windows Copilot General Availability September 26, 2023 Read More »
Voip.ms is a reliable, affordable and customizable VoIP service. Sign-up with my referral code to get $10 discount. Recently I
Voip.ms get call detail records and set call detail record filters using API Read More »
OpenAI ChatGPT 4 Advanced Data Analysis is pretty amazing! I put it to the test on some data I analysed
OpenAI ChatGPT 4 Advanced Data Analysis used to do river water flow analysis Read More »
It was a very happy coincidence that I was in London, UK to be able to attend this May 23,
Attended London Power BI User Group: Introducing Fabric! – London, UK – May 23, 2023 Read More »
I created a Fabric Dataflow Gen2 Web API connection to retrieve csv file data from an Environment Canada daily environmental
Fabric Dataflow Gen2 Web API connection with dynamic current date parameter Read More »
Attended the excellent Data Science Festival Mayday event May 20, 2023 in London, UK at CodeNode, Moorgate and Old Street.
Attended Data Science Festival Mayday – London, UK – May 20, 2023 Read More »
This post is focuses on a project of the analysis of scaped comments from CBC News website articles. (BTW, there
CBC news article comments analysis and visualization Read More »
The CBC (Canadian Broadcasting Corporation) news website articles often have a comments section. It would be interesting to see the
CBC news comment and replies interaction network visualization Read More »
opencellid.org has global cell tower location data that I used to do a series of QGIS maps showing Canada’s cell
Canada cell tower distribution QGIS visualization Read More »
This post is focuses on a project where I scaped comments from CBC News website articles. (BTW, there are lots
CBC news article comments web scraping Read More »
Once upon a time, I was using Xero to record and manage a company’s finances and wanted to use Zebra
Xero.com data consolidation and reporting solution selection Read More »
The Government of Canada is working with Canadian First Nations communities to end long-term drinking water advisories which have been
Canadian Government First Nations long term water advisory data Read More »
This is a list of Canadian COVID-19 related data analysis and visualization that I created during 2020/21 pandemic. Canada COVID-19
COVID-19 Data Analysis and Visualization Summary Read More »
For a 16 month period, from February 2020 to June 2021, TendiesTown.com used the Reddit API in an automated process
TendiesTown.com – WallStreetBets gain and loss analysis Read More »
Our World In Data (OWID) has been doing a hero’s job of collating the world’s covid vaccine distribution and administration
Use Excel Power Query to get data from Our World In Data Read More »
Sir Patrick Stewart @SirPatStew was doing Shakespeare Sonnet readings from his home during the COVID-19 lockdown and they were really
Sir Patrick Stewart @SirPatStew #ASonnetADay dashboard Read More »
“Space… is big. Really big. You just won’t believe how vastly, hugely, mindbogglingly big it is” (quote from The Hitchhiker’s
The human radio-broadcast bubble Read More »
TLDR: I used Amazon Transcribe to transcribe the first presidential debate audio that included timestamps for each word, to create
Amazon AWS Transcribe used to get 2020 presidential debate #1 speaker segments Read More »
This visualization shows COVID-19 new cases as a “race” of dots moving from left to right. The dot’s “speed” or
D3.js SVG animation – COVID-19 rate “race” visualization Read More »
TLDR: I extracted text from the WHO’s vaccine candidate PDF file using AWS Textract and made text into a set
This cool periodic chart of the elements shows source / origin of the chemical elements. Source: Wikipedia created by Cmglee
Periodic chart elements by origin from SVG using Python Read More »
Recently needed to get flow and level data for a watercourse hydrological station as well as regional precipitation data for
Retrieve and process Environment Canada hydrometric and climate data using Python Read More »
Plotly.py 4.5, Plotly Express no longer puts the = in trace names, because legends support titles (source). Prior to Plotly.py
Plotly Express Python remove legend title Read More »
A Leaflet tutorial uses the following hard-coded getColor function to return colors. // get color function getColor(n) { return n
Legend and polygon colors for Leaflet choropleth using Chroma.js Read More »
During the 2020 COVID-19 pandemic in Canada I wanted to get COVID-19 confirmed cases counts data for the city of
Scraping public health web page using Python, BeautifulSoup4, Requests and Pandas Read More »
During the 2020 COVID-19 pandemic in Canada I wanted to get better understanding of the geographical distribution of COVID-19 related
During the early days of the 2020 COVID-19 pandemic in Canada, I wanted to get better understanding of the geographical
Choropleth map of Canada COVID-19 cases by health region using Leaflet and D3.js Read More »
GlobalPrePaidCreditCard.com – Prepaid and gift credit card feature comparison for 9 countries. Sort and filter cards by features to find the
To quickly and easily delete Google Calendar events by date you can use Google Script https://script.google.com to run the following
Delete Google Calendar events by date using Google Script Read More »
I have a Office 365 Business Premium account. I wanted to sync many large folders with OneDrive for Business. However,
OneDrive SharePoint Migration Tool (SPMT) Read More »
This is an example of how to read a csv file retrieved from an AWS S3 bucket as a data
AWS S3 csv file as D3 report data source Read More »
What is Power Query? Power Query is an Microsoft tool for Excel and Power BI that is used to do
Introduction to Microsoft Power Query in Excel and Power BI Read More »
Require an SSL Connection to a PostgreSQL DB Instance? Here are some notes from my investigations. http://docs.aws.amazon.com/AmazonRDS/latest/UserGuide/CHAP_PostgreSQL.html#PostgreSQL.Concepts.General.SSL Not great examples
AWS RDS Postgres database external secure connection Read More »
I have a local Hadoop server running on my Windows laptop. To connect Power BI to this Hadoop file system
How to use Hadoop HDFS as a datasource for Power BI Read More »
Step 1 – Download latest version of Power BI to get new features (version that came out in early August
How to use Python as a datasource for Power BI Read More »
Here is a blog post from old Word Press site I wrote back in July 7, 2004 Comparison of my
Comparison of my old Palm vs my new Pocket PC (from 2004) Read More »
The Province of British Columbia publishes public agency executive compensation each year. The data is grouped by: Sector – Employers
BC Executive Compensation Tableau Visualization Read More »
The process of engaging IT teams can be difficult to understand for many non-technical people. IT is perceived as a
Business Intelligence – IT Black Box Challenge Read More »
I have created my own historical reporting of my Twitter account followers and list memberships. I have hosted the reporting
Twitter Followers and List Membership Tracking Read More »

It turned out to be quite simple to install Hadoop on Windows 8.1 I have been using Hadoop Virtual Machine
Installing Hadoop on Windows 8.1 Read More »

Recently I developed a Django web application for a friend. I wanted to be able to get it up and
Vultr and Digital Ocean make it easy to get projects going fast Read More »
One of my Django applications includes a form where user can enter and submit a property address. The user submitting the form
Django form geocode submitted address to get lat, lon and postal code Read More »
I have a Django web application that needed an interactive map with shapes corresponding to Canadian postal code FSA areas
Leaflet.js choropleth map color by count using geoJSON datasource Read More »
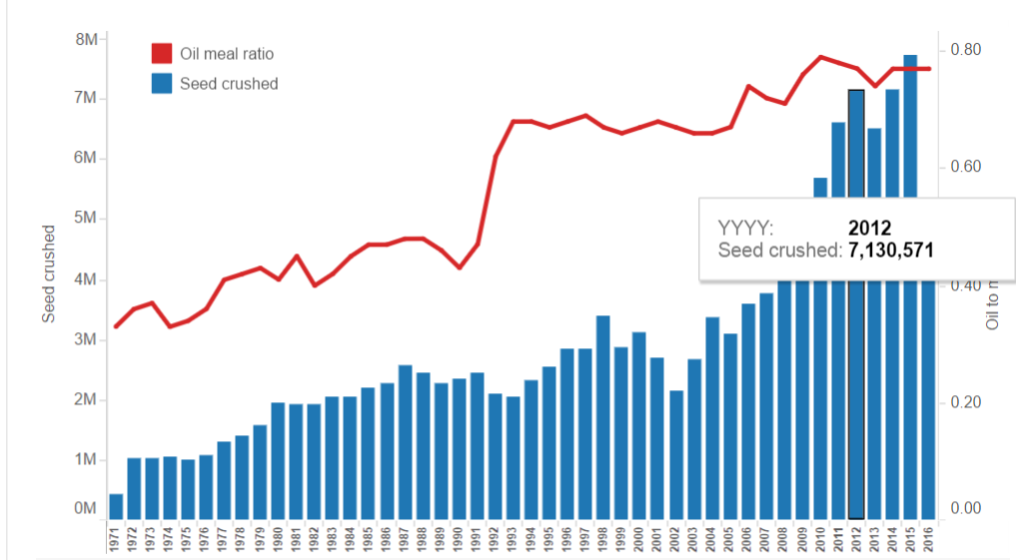
Statistics Canada regularly tweet links to various Canadian statistics. I have occasionally created quick Tableau visualizations of the data and
Canadian Canola seed crushing more efficient at extracting canola oil Read More »
Chart.js V2.0 is a useful javascript charting library. It looks great, has ton of features though it is new enough
Chart.js tooltip format number with commas Read More »
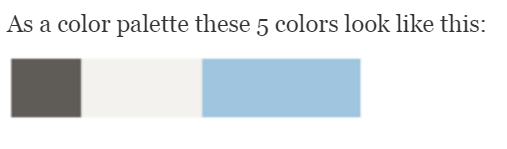
I created a web application that included screenshots of about 190 country’s national statistics agencies website home page. I created the site
Python get image color palette Read More »
This data comes from Statistics Canada. Statistics Canada download pages often provide the opportunity to modify the data structure and
Excel Power Query tutorial using Canadian potato production statistics Read More »
Django’s makemigrations and migrate commands are very useful to update existing database tables to reflect model changes. However if you
Django recreate database table Read More »
Blog post updated to add the following: Updated Python “TCS Members Details” code to get additional information from the List
Canadian TCS FDI Officers Twitter list member analysis Read More »
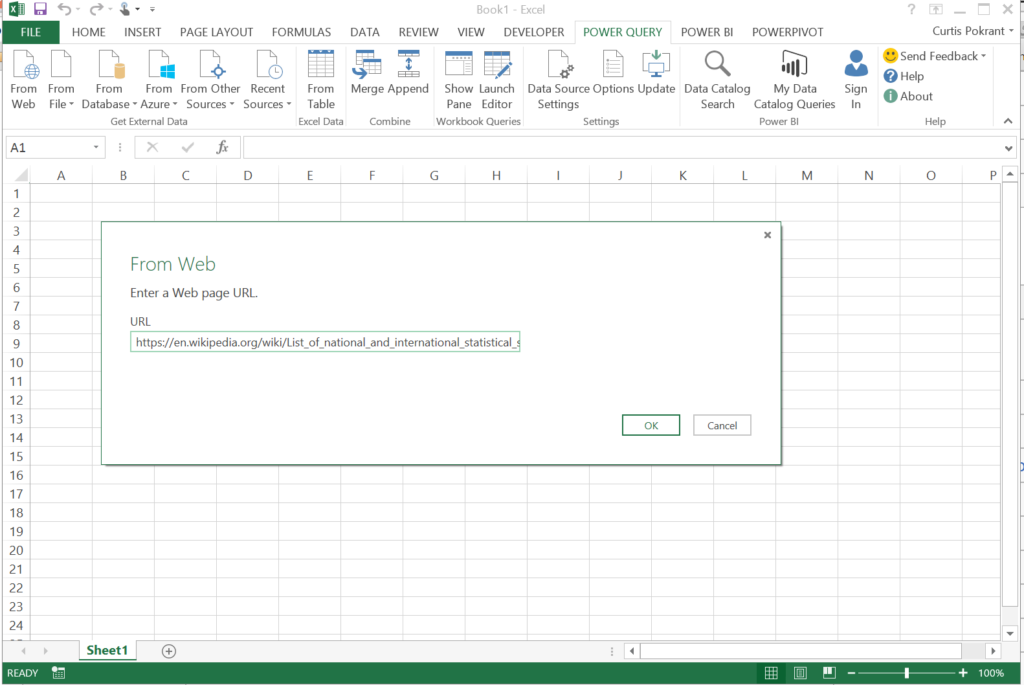
Power Query is quick and easy way to scrape HTML tables on web pages. Here is step by step on
Use Excel Power Query to scrape & combine Wikipedia tables Read More »
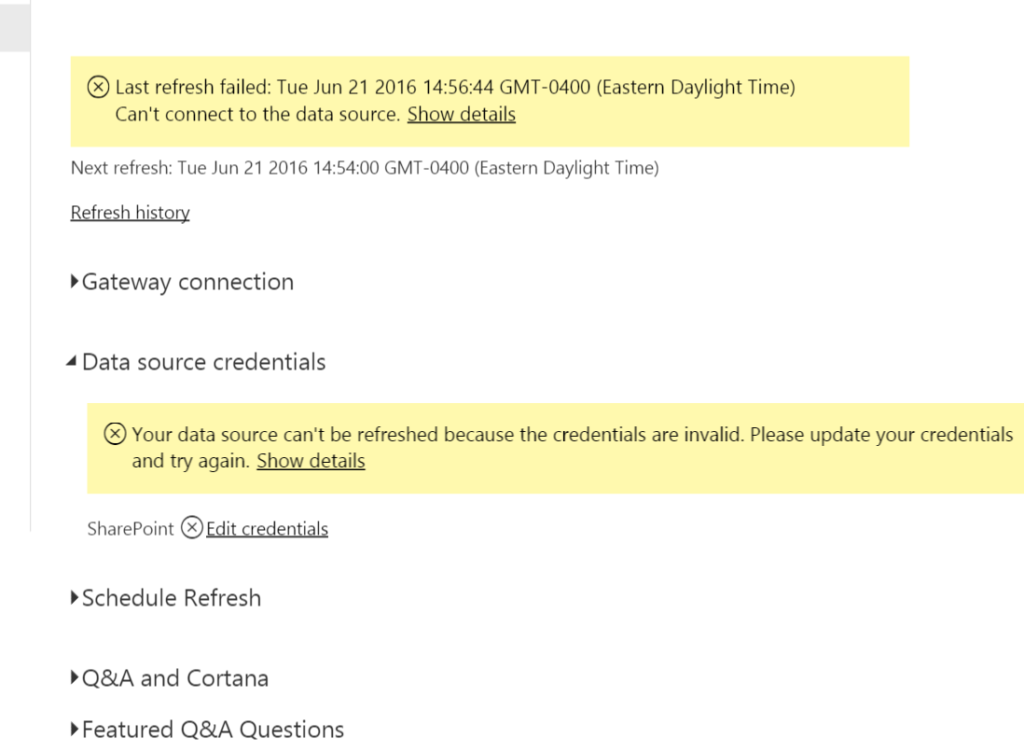
I recently changed my Office 365 user password for an account that I was using for a Power BI Dataset
How to update Office 365 password in Power BI dataset refresh Read More »
A Power BI Report with multiple charts or other objects can be added to a Dashboard in Power BI Online
How to avoid wide margins on a Power BI dashboard Read More »
Google’s APIs make getting Adsense (or any other Google service) data easy to download. The code below downloads Adsense data
How to use Google Adsense API to download Adsense data Read More »
I have been using Python 2.7 for most of my Python work but have a few projects where I want
Create Python 3 Virtualenv on machine with Python 2 & 3 installed Read More »
I have automated uploading files from my web site host’s server to my Office 365 Sharepoint site using scheduled cron jobs running
Use OneDrive API to upload files to Office 365 Sharepoint Site Read More »
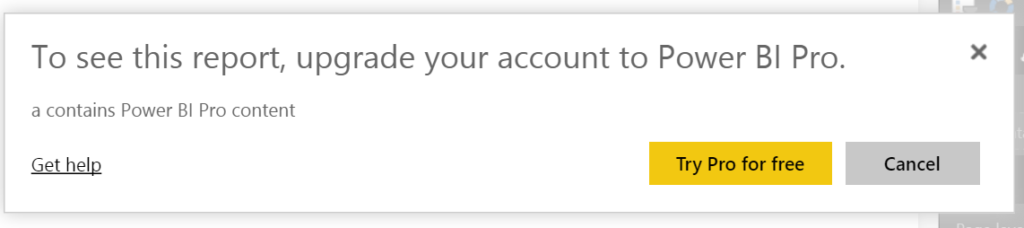
This was a weird quirk. I have Power BI Free account and uploaded a report to Power BI Service. The
Careful! Don’t click “Try Power BI for free” Read More »
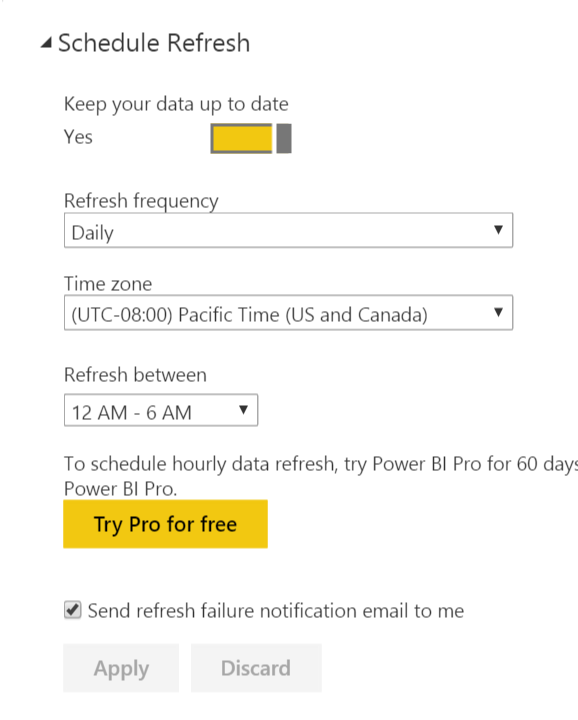
Do you want to create a Power BI Report that gets a daily scheduled refresh of data from a Sharepoint
How to schedule Power BI dataset refresh Read More »
I want to create a Power BI Online report with a data source from a file on a remote web server that updates
Power BI Online – get data from Office 365 Sharepoint file Read More »
Microsoft has three file storage options: OneDrive Personal OneDrive Business Sharepoint These have recently been unified into one new OneDrive API https://dev.onedrive.com and oAuth
OneDrive API features Read More »
Happened to see Cuba Gooding Jr’s first tweet about 30 minutes or so after he created it. Update: @cubagoodingjr is no
Tracking Cuba Gooding Jr’s Twitter follower count Read More »
Once upon a time, I needed to find Dell monitor data to analyse. A quick search brought me to their eCommerce
Dell ecommerce web site scraping analysis Read More »
Excel Power Query can make a connection to MySQL database but requires that you have a MySQL Connector/Net 6.6.5 for
Power Query MySQL database connection Read More »
Say you have a need to deliver multiple websites which have same structure but each site is served on different
How to serve multiple domain name websites with one CakePHP application Read More »
When learning to develop Django and Flask Python applications using virtual environment I did not know that I should activate
Always remember to start Python Virtualenv Read More »
Flask-SQLAlchemy relationship associations are useful to easily retrieve related records from a related Model. In a Python Flask application I
Flask SQLAlchemy relationship associations and backref Read More »
Wirebase was a concept created in 2001 before broadbrand, wired or wireless was widely available. The concept was shopped around
Using ATMs as wifi hotspot Read More »
This is a post on how to create custom Google Analytics Profile Segments for the purpose of removing referral spam
Get list of custom segments from Google Analytics API Read More »
I wanted to be able to show locations by latitude and longitude with data from Django 1.8 website on a
Display Django queryset results on Google Map Read More »
The Twitter API allows you to read and write tweets on your own Twitter account. But you can also create
How to setup and and use a Twitter API application Read More »
The newest Google Charts API allows you to more easily change the axis that you want the ticks and labels
How to move Google Chart x-axis to top of chart Read More »
BC Hydro made an amazing social media turnaround to communicate with customers in crisis! Go BC Hydro! On August 29,
BC Hydro’s amazing #BCStorm social media turnaround Read More »
Microsoft has a free Microsoft Data Management Gateway that you can install on your desktop or server to act as
How to create OData data source Gateway for Power BI Report Read More »
Here is a demo web application / SaaS called SpeedVisit that individuals and companies can use to easily and quickly record
Introducing Speedvisit – a quick and easy way to record visits from people Read More »
Google Analytics data has become incredibly polluted by “spam referrals” which inflate site visits with what are essentially spam advertisements
How to filter referral spam from Google Analytics using API and Python Read More »
The City of Toronto’s open data site includes the results of the city’s regular food and restaurant inspections. This data
Tableau vizualization of Toronto Dine Safe data Read More »
I have a bunch of websites that have the same structure and content that vary only by the category for
Single CakePHP application & MySQL database to serve multiple domains Read More »
Back in the days when I was working in environmental science, the consulting firm I was working for was doing
How a new salmon stream was carved from the land Read More »
I happened to have an dataset of Car2Go vehicle locations in Vancouver and used Tableau to plot them by latitude and
Tableau vizualization of Vancouver Car2Go vehicle locations Read More »