Legends can be quite fiddly to include on a chart when the chart content can dynamically change and result in dramatic changes in y-axis values and count of x-axis values.
This is not limited to Apache EChart but including a legend in a recent EChart visualization I was working on was getting too complex and it needed a new solution.
That solution was to include a faux legend in the chart’s Title which is something I have done from time to time using other visualization tools but this was the first time I did it in ECharts.
The trick was to assign the legend text value colors using the the chart title’s textStyle – rich text feature as demonstrated in the code snippet below.
The result is a simple, good looking, compact legend beneath the chart title.A
This tennis rank visualization can be viewed at /demos/tennis-data/
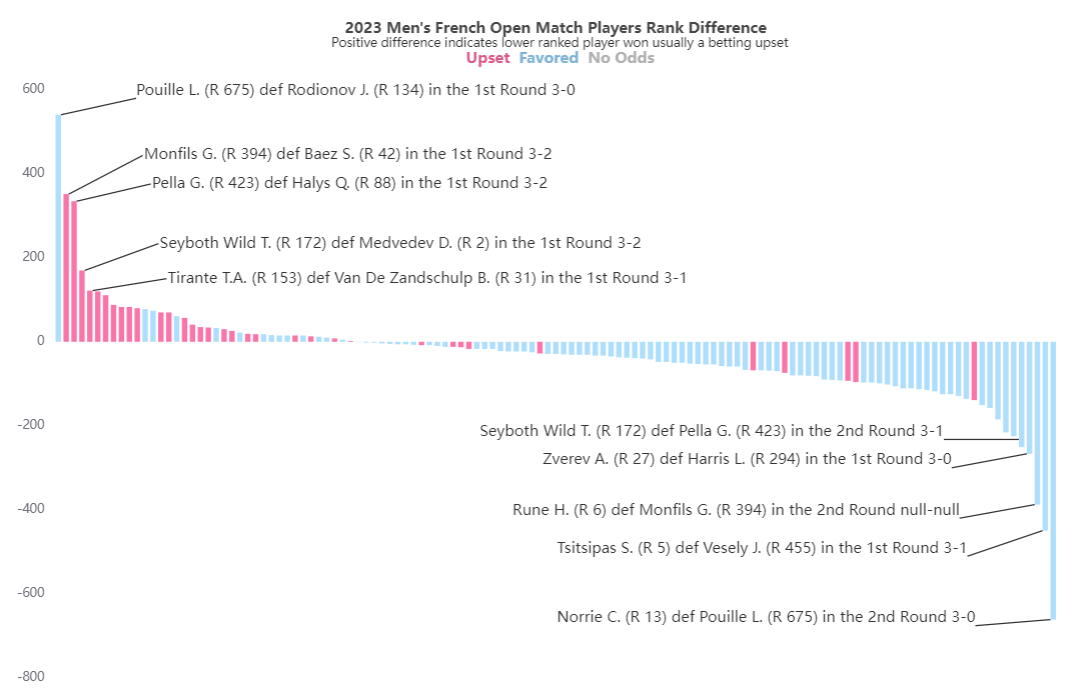
The code snippet below demonstrates the chart options title with the textStyle rich text values.
const option = {
  title: {
    show: true,
    text: `${year} ${tournamentName}\n {upsetColor| Upset} {favoredColor| Favored} {noOddsColor| No Odds}`,
    left: "center",
    textStyle: {
      fontWeight: "bold",
      fontSize: 16,
      rich: {
        upsetColor: {
          color: "#D85A8A", // Color for 'Upset'
          fontWeight: "bold",
        },
        favoredColor: {
          color: "#7FB3D5", // Color for 'Favored'
          fontWeight: "bold",
        },
        noOddsColor: {
          color: "#B0B0B0", // Color for 'No Odds'
          fontWeight: "bold",
        },
      },
    },
  },
};